As is usual for me, code outside of work comes out of curiosity.
I’ve always known that there is a lot of negativity in social media around Monsanto and GMO’s but I had no idea how much chatter there was about them. I started some code on this in late August and due to the continual talk around a merger with Bayer, I added them as a search term. While I still have data to look into determining the negativity vs. positivity used in tweets, I focused on frequency over time and words used around the merger announcement for this post.
I had done some data scraping before with Twitch Chat using python 3 and postgres to scrape data from public chat rooms. Since I already had some experience with python + postgres I opted to use a similar setup this time. Using tweepy I wrote a bot to stream tweets into a pg database on a spare laptop.
My pg database is setup on my laptop running linux mint but any OS/hardware should work in theory. My table definition is at create_table.sql.
main.py handles the scraping of data into the database. Below you can see the main loop portion where it runs try: on stream.filter() to stream the tweets with words of interest into the database. This is run simply with python main.py and left to run.
    while True:
        try:
            stream.filter(track=config.SEARCH_KEYS)
        except AttributeError as e:
            print(e)
            time.sleep(5)
            continue
        except KeyboardInterrupt:
            break
Once we have enough data we can actually look at it. For this I used R with ggplot2 to visualize my data.
tweet-viz.R holds all the code. It optionally can uncomment sourcing common-words.R to create a word cloud of the words used on the day of the merger announcement.
First the function get_data() is defined to pull all of the data out of our database. At the time of this post I was able to lazily get away with select * from tweets; due to the data being small enough and mostly in the time period of interest. In the future selecting the proper columns and limiting by a time range could be necessary.
get_data <- function(){
	drv <- dbDriver("PostgreSQL")
	con <- dbConnect(drv,
					 dbname="twitter",
					 host="192.168.1.254",
					 user=Sys.getenv("DB_USER"),
					 password=Sys.getenv("DB_PASS"),
					 port="5432")
	on.exit(dbDisconnect(con))
	res <- dbSendQuery(con, "select * from tweets;")

	data <- dbFetch(res)

	#Clearing the result
	dbClearResult(res)

	#Function: dbClearResult (package DBI)
	res="PostgreSQLResult"

	#disconnect
	dbDisconnect(con)
	dbUnloadDriver(drv)
	return(data)
}
Next we call the function and slim down our data set ensuring monsanto, bayer, and gmo are included in the tweet text and that the tweets happened the work week of the announcement. Lastly we determine the top 5 tweet languages used for graphing.
raw_dat <- get_data()

monsanto_tz <- "America/Chicago"
dat <- raw_dat %>% filter(grepl("(monsanto|gmo|bayer)",tolower(raw_dat$tweet))) %>% select(tweet_lang, timestamp_ms)
dat$timestamp_ms <- as.POSIXct(as.numeric(dat$timestamp_ms)/1000, origin="1970-01-01", tz="America/Chicago")

lims <- as.POSIXct(strptime(c("2016-09-11 00:00","2016-09-16 23:59"), tz=monsanto_tz, format = "%Y-%m-%d %H:%M"))
dat <- dat %>% filter(timestamp_ms >= lims[[1]] & timestamp_ms <= lims[[2]])

top_lang <- dat %>% group_by(tweet_lang) %>% summarise(n=n()) %>% top_n(5,n) %>% arrange(-n)
dat$tweet_lang <- factor(dat$tweet_lang, levels=top_lang$tweet_lang)
Now that we have our data the way we want it, we create 3 graphs.
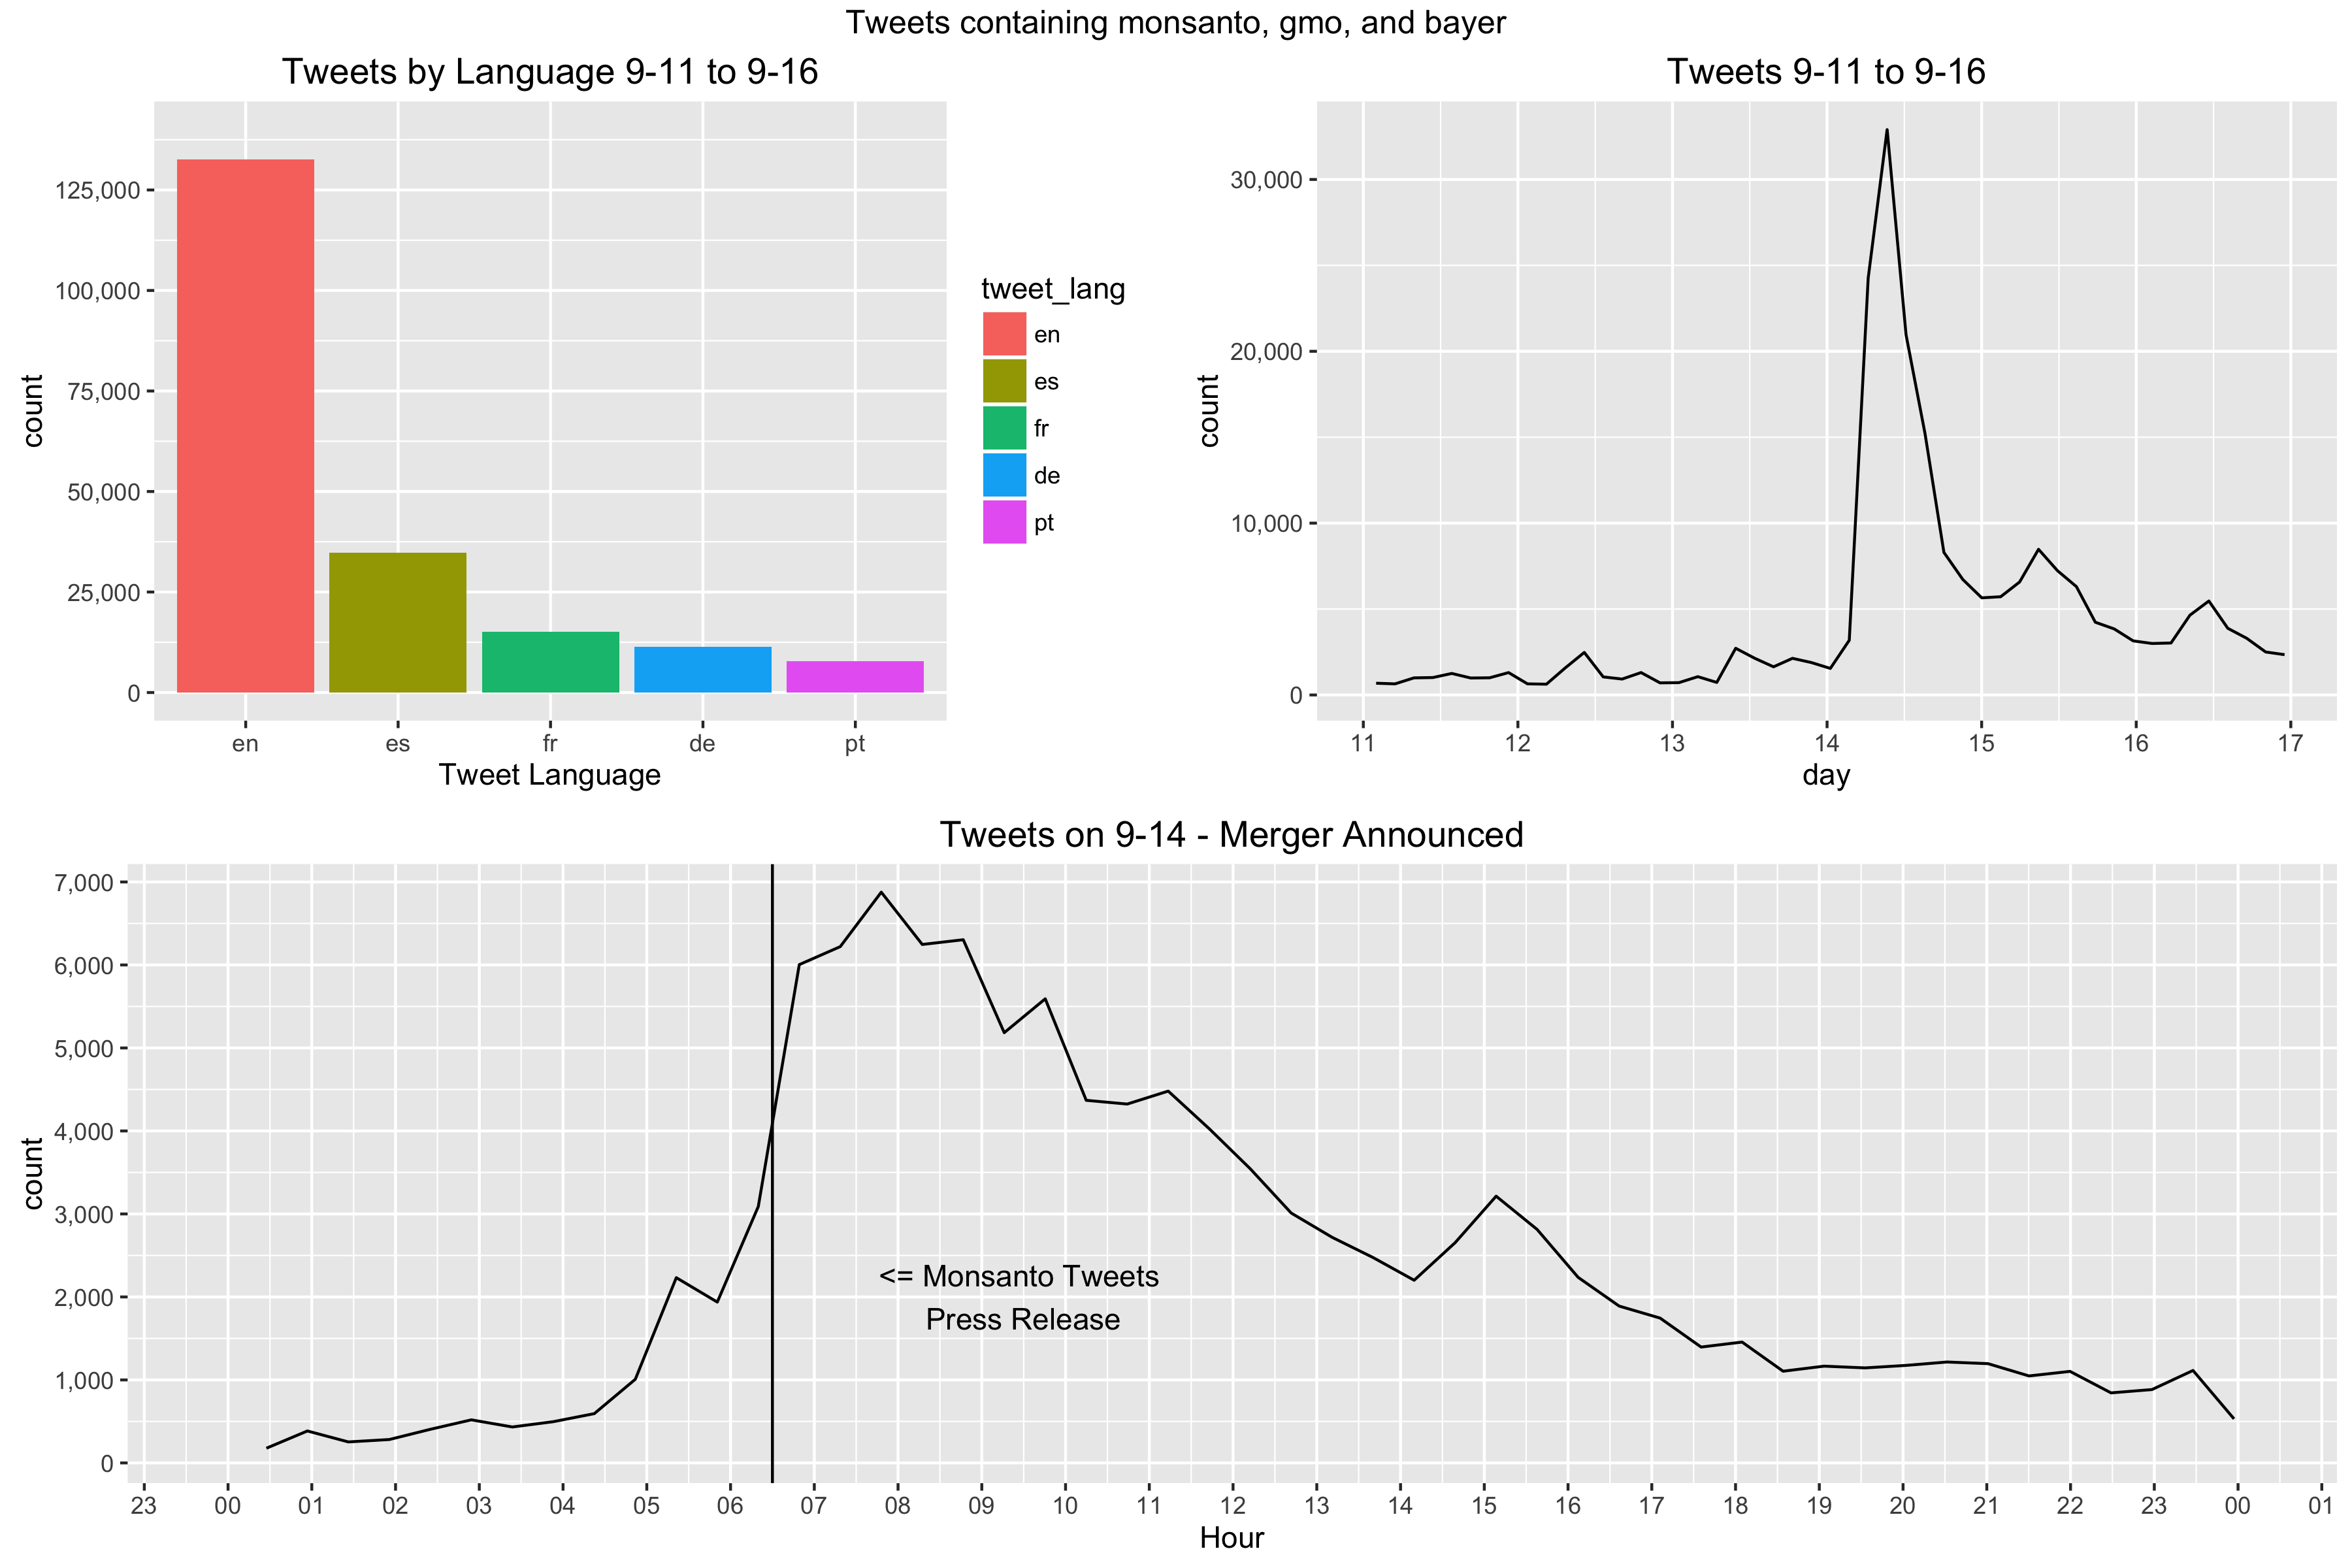
Graph 1: Tweets by Language; A look into the variety in languages used in tweets English I expected as a top language but others I was interested to see. None were terribly surprising considering South American Agriculture (Spanish/Portuguese) and European interest in Bayer (German/French) but still interesting to see how it was distributed.
Graph 2: Tweets 9-11 to 9-16; A high level view of the amount of tweets written the work week of the announcement. Most activity was on the day of but a few small spikes happened days after.
Graph 3: Tweets on 9-14 - Merger Announced; The day of the announcement with a vertical bar for the timestamp of the tweet Monsanto sent out regarding it. Time is in the US Central Timezone (aka the timezone of Monsanto HQ).
top <- top_lang$n[[1]]
digits <- 10 ** (nchar(top)-2)
cap <- ceiling(top/digits)*digits
plot_dat <- dat %>% filter(tweet_lang %in% top_lang$tweet_lang) %>% select(tweet_lang)
gplot1 <- plot_dat %>% ggplot(aes(tweet_lang)) +
			geom_bar(aes(fill=tweet_lang)) +
			labs(x="Tweet Language") +
			ggtitle("Tweets by Language 9-11 to 9-16") +
			scale_y_continuous(breaks=seq(0,cap,digits*2.5),
							   limits=c(0,cap),
							   labels=scales::comma)


gplot2 <- dat %>% ggplot(aes(timestamp_ms)) +
			geom_line(stat="bin", bins=50) +
			labs(x="day") +
			ggtitle("Tweets 9-11 to 9-16") +
			scale_y_continuous(labels=scales::comma) +
			scale_x_datetime(breaks=date_breaks("1 day"),
							 labels=date_format("%d"),
							 limits=lims)

lims <- as.POSIXct(strptime(c("2016-09-14 00:00","2016-09-14 23:59"), tz=monsanto_tz, format = "%Y-%m-%d %H:%M"))
plot_dat <- dat %>% filter(timestamp_ms >= lims[[1]] & timestamp_ms <= lims[[2]])
press_release_dt <- as.POSIXct(strptime("2016-09-14 06:30",tz=monsanto_tz, format = "%Y-%m-%d %H:%M"))
gplot3 <- plot_dat %>% ggplot(aes(timestamp_ms)) +
	geom_line(stat="bin", bins=50) +
	labs(x="Hour") +
	geom_vline(xintercept = as.numeric(press_release_dt)) +
	annotate("text", x=press_release_dt+3600*3, y=2000, label="<= Monsanto Tweets \nPress Release") +
	ggtitle("Tweets on 9-14 - Merger Announced") +
	scale_y_continuous(breaks=seq(0,8000,1000), labels=scales::comma) +
	scale_x_datetime(breaks=date_breaks("1 hour"),
					 labels=date_format("%H", tz=monsanto_tz),
					 limits=lims)

png("TweetStats.png", width=12, height=8, units="in", res=300)
grid.arrange(gplot1, gplot2, gplot3, layout_matrix=rbind(c(1,2),3), top="Tweets containing monsanto, gmo, and bayer", nrow = 2)
dev.off()
The image produced by the above code is below.

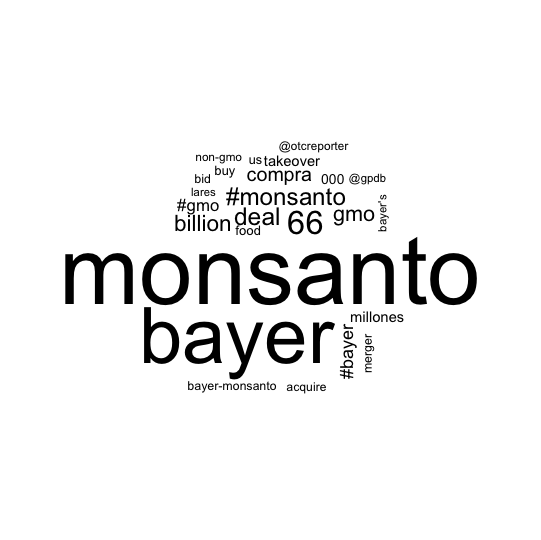
Now that we know how many tweets were posted and what languages they were in, we can look into creating a word cloud of the words used to talk about the merger.
I had never done a word cloud in code before this. All my experience in word clouds was dropping chunks of text into online tools and then saving the image so this was a learning experience.
The code does similar filtering of the raw data from postgres and uses the tm package to remove common words we are not interested in viewing. Using dplyr & table the data is arranged and filtered down to the top 50 words and then visualized using wordcloud(). Depending on the resolution used the words can overlap or be spread to far apart. In Rstudio I had trouble using the plot pane to view my work as it was too small. Upon expanding it the words snapped into a good position. Not the greatest word cloud ever created but it’ll work. I decided to include numbers in mine as the specific number 66 was important as the number in billions that Bayer is paying for Monsanto.
#word stats#
library(tm)
library(SnowballC)
library(wordcloud)


split_tweet <- function(tweet){
	text <- unlist(strsplit(tweet,"[^#@'’\"a-zA-Z0-9\\-]+"))
	return(text)
}

# Use raw_dat from tweet-viz.R
monsanto_tz <- "America/Chicago"
dat <- raw_dat %>% filter(grepl("(monsanto|gmo|bayer)",tolower(raw_dat$tweet))) %>% select(tweet, timestamp_ms)
dat$timestamp_ms <- as.POSIXct(as.numeric(dat$timestamp_ms)/1000, origin="1970-01-01", tz="America/Chicago")

lims <- as.POSIXct(strptime(c("2016-09-11 00:00","2016-09-16 23:59"), tz=monsanto_tz, format = "%Y-%m-%d %H:%M"))
dat <- dat %>% filter(timestamp_ms >= lims[[1]] & timestamp_ms <= lims[[2]])

words <- sapply(dat$tweet, split_tweet, USE.NAMES=F)
words <- sapply(words,tolower,USE.NAMES = F)
words_ul <- as.character(unlist(words))
words_ul <- gsub("#","",words_ul)

built_in_stop <- unlist(sapply(top_lang$tweet_lang, stopwords))
# remove twitter links/RT words
twitter_words <- c("t","co","http","https","rt","amp","#")
# common words
common_words <- c("the","The","to","of","a","in","is",
				  "and","","de","by","for","la","has",
				  "on","se","it","with","that","que",
				  "al","as","y","en","s","t","el","es",
				  "a","at","S","r","un","m","u","n","por",
				  "d","te","via","le","an","i","la","para",
				  "los","-")
my_stop_words <- c(built_in_stop,twitter_words,common_words)

words.df <- data.frame(table(words_ul))
words.df <- words.df %>% rename(words=words_ul)
words.df$words <- as.character(words.df$words)
words.filtered <- words.df %>% filter(!words %in% my_stop_words) %>% arrange(-Freq) %>% head(50)

# save the image in png format
png("TweetCloud.png", width=12, height=8, units="in", res=300)
wordcloud(words.filtered$words,words.filtered$Freq, scale=c(6,.5),
		  max.words = 25, random.order=F,
		  colors=brewer.pal(8, "Dark2"))
dev.off()
At long last, here is our word cloud:

Below is the repository for the code I used in this post and the latest commit in case I make future changes that break code shown here. If you have any questions feel free to reach out on Twitter or by Email
Code: clesiemo3/mon-twitter
Latest Commit as of this post: 001429e6c20a5a1794d4ee2233879116adf04c6c